Now, it’s true that this blog is focussed on Source-to-Pay and it’s true that, as a result, we usually focus on Strategic Sourcing Decision Optimization and occasionally on Logistics-focussed Models and Optimization Solutions, as that what’s typically needed for a Sourcing Professional to make the optimum buy, but this time we’re going to make an exception.
Why is network modelling an exception (besides the fact that, as we told you yesterday when we said Don’t Overlook the Network, it has the absolute best return on investment across all supply chain applications)? Well, if you think about classic network modelling, it’s not something a sourcing professional would do because it’s typically up to logistics and supply chain to maintain the network infrastructure that gets the product from the suppliers to the ports and warehouses and then to the distribution centres, retail facilities, and end consumers in drop-ship models. It’s up to logistics to re-evaluate the supporting network infrastructure on a bi/tri-annual basis and determine if warehouses should be added, relocated, or deleted (on lease end); if ports should be changed (to reduce overall costs due to port fees or local carrier costs or rail vs truck options); if new carriers should be considered; and so on.
The reason that this is typically only done on a bi/tri-annual basis is because it has traditionally been an arduous endeavour where you have to
- build a very detailed model of all
- the supplier production facilities, ports, warehouses, distribution centers, manufacturing/assembly centers, and retail facilities
- the lanes used
- the modes used for each lane
- the carriers used for each mode / lane combination
- the LTL and FTL rates for each carrier
- the drop-ship rates for direct-to-consumer
- identify all of the products being purchased and
- associate them with the appropriate suppliers
- associate them with the appropriate lanes, modes, and carriers
- associate them with the appropriate warehouses
- associate them with the appropriate retail locations or drop-ship locations
- collect all of the current rates, for every supplier-carrier-lane-mode option in use
- then solve a current-state optimization problem to determine baseline costs, times to serve, carbon emissions, etc.
- identify all of the potential port and warehouse locations you could (also) use
- identify all of the new lanes that would create
- identify all of the additional carriers that could be used
- collect quotes for every lane-carrier-mode combination from the potential new options that might actually be used
- then build an extended model that includes all options and feed in all of the data
- then solve a full-state model to determine baseline costs, times to serve, carbon emissions, etc.
- then determine the ranges for the number of ports, warehouses, distribution centers, carriers, time to serve, carbon emissions, etc. that are acceptable
- solve a copy of the restricted full-state model to determine a new baseline cost
- then make and create copies of the model and run analysis against different objectives until the model is acceptable, and the costs (time to serve, emissions, etc.) reduced significantly enough to do a network transformation exercise
and this endeavour would typically take three to six months due to the fact it would take weeks to build the baseline models, months to collect the data, and weeks to build, solve, and analyze the models and come up with a new state that improved all the measures of interest as well as the implementation plan to make it happen.
But the problem with doing this bi/tri-annually is that you never know the impact of adding a new supplier or, more importantly, replacing a supplier of a significant product line or category where that supplier is in a completely different location, and possibly one that the last network design never took into account. Plus, the removal of a big supplier might cause a certain node (warehouse, distribution center, etc.) to be significantly under-utilized, resulting in unexpected overspend in certain parts of the distribution network.
But this knowledge is critically important to know before making a major sourcing decision that might change the supply base for a highly utilized product line or category — because the costs of the award will not be the expected costs. They will not be the unit or expected transportation costs used in the analysis that the award decision is based on, but will instead be those costs plus the fixed and variable losses incurred from underutilizing a sub-set of the network and/or overutilizing another sub-set of the network.
While this has always been the case, as the belief was that nothing could traditionally be done about it, if there was a tool that could
- actively maintain the current network model
- allow for copies to be created on the fly
- allow for those copies to be easily modified, including
- the addition or deletion of nodes (suppliers, ports, warehouses, distribution centers, retail locations, etc.)
- the definition of new lanes
- the the addition of carriers and/or carrier modes
- updated costs for every lane
- solve those copies quickly and accurately
then a sourcing professional could have deep insight into whether their cost models and assumptions are correct and logistics could update the network model, or at least the future state (if leases/contracts need to expire and new leases/contracts need to be signed), upon every award, and the overall sourcing, logistics, and supply chain costs.
And this is what you can do with Logility Network Optimization, formerly Starboard Solutions (acquired in 2022) and exactly why we are making an exception and covering them.
With the Logility Network Optimization Solution (which really should be called Logility Starboard, for reasons that will soon become clear), a Sourcing Professional can:
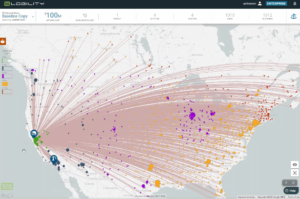
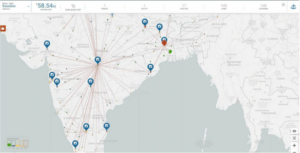
- instantly see a graphical view of the current global network
- bring up reports that summarize all of the key data
- drill in to node / carrier / supplier / port / warehouse / distribution / product / combination costs
- create a copy of the current network with all relevant data
- and then create a what-if baseline scenario where they can
- add whatever they wish (through simple pop-up interfaces they can add nodes and relationships),
- remove whatever they wish (by simply clicking on a node or searching for the entity or relationship and deleting it), and, most importantly,
- change whatever they want through in the network design through a simple drag-and-drop mechanism
- they can then specify any constraints and goals, run an optimization, and see the new costs, and, most importantly, extract lanes / costs / variables of interest to populate into the TCO (total cost of ownership) calculations in their sourcing events

Furthermore, because it is a true multi-tenant cloud solution that uses a distributed “serverless” model that can decompose tasks into subtasks that can be run in (a massively) parallel (manner), such as data fetching, sub-model building, and even model solving (as all optimization models can be solved by solving sub-models on convex subspaces of the high-dimensional solution space), it can do it fast. And it’s just as accurate as the traditional, prior generation tools, at a speed that is breakneck in comparison, and that’s even if it uses statistically significant calculated data.
Moreover, it’s very easy to define multiple constraints and weighted objectives. You can guarantee maximum times to serve / times to deliver (subject to minimums that cannot be improved upon) while balancing overall cost and carbon footprint (through a weighted objective). (It’s quite easy to define objectives in the platform which have built in pop-ups to solve for different goals — service time, emissions limit, cost, and best X, where X is a single dimension or derived dimension that weights 2 or more other dimensions.) Or you can guarantee maximum times to serve, a fixed / x% carbon reduction, while minimizing overall cost. Or you can keep ports you know are stable and the warehouses with contracts you can’t break while allowing the delivery network architecture to shift to minimize overall costs.
The browser based interface to Logility’s platform offers a graphically represented virtual twin to an organization’s network with high-level summary data (products, facilities, lanes, suppliers, customers, activities, and costs) with easy scenario selection and easy definition and modification of scenarios. It’s very easy to dive into definition screens and see the suppliers, facilities, lanes, etc. and see/edit all of the data for any individual supplier, facility, lane, etc.; add a new instance, delete one, and see the associated costs, times, emissions, etc. and the underlying calculations associated with a node or relationship in the network graph (which is stored in a graph database that allows for massive scalability).
It’s also very easy to dynamically generate comparison reports between scenarios that compare (activity) costs (across cost types, such as leases, handling, transport costs, rail costs, ocean freight, tariffs, etc.), (average) service times (by supplier, product, lane, etc.), carbon (by carrier, lane, product, supplier, etc.), and other metrics of interest. Furthermore, when a user is happy with a scenario, they can one-click generate and output a complete comparison / summary report deck to PowerPoint for executive reporting (across as many scenarios as they like).
To enhance usability — which is quite obvious out-of-the-box to anyone who understands the basics of modelling, optimization, and decision analysis — Logility has an integrated quick-tour to get started, a full multi-media course on the platform and the modelling that can be done, playbooks for particular problems and challenges, and weekly office hours where users can ask Logility pros questions and get answers in real time. Logility Network Optimization was designed from the bottom up for usability and success.

