Today’s post is from Eric Strovink, the spend slayer of spendata. real savings. real simple. Eric was previously CEO of BIQ; before that, he led the implementation of Zeborg’s ExpenseMap, which was acquired by Emptoris and became its spend analysis solution.
If you have a contract with a vendor, you should be paying the contract price. But until you check, you don’t really know — and what you find out may surprise you.
In Part I of this series we discussed the two pieces of data required — transactions from the vendor, and contract prices for the items under contract. The next step is to join those two datasets together, in this case by Part Number.
Here is what that might look like if we do it in Excel:
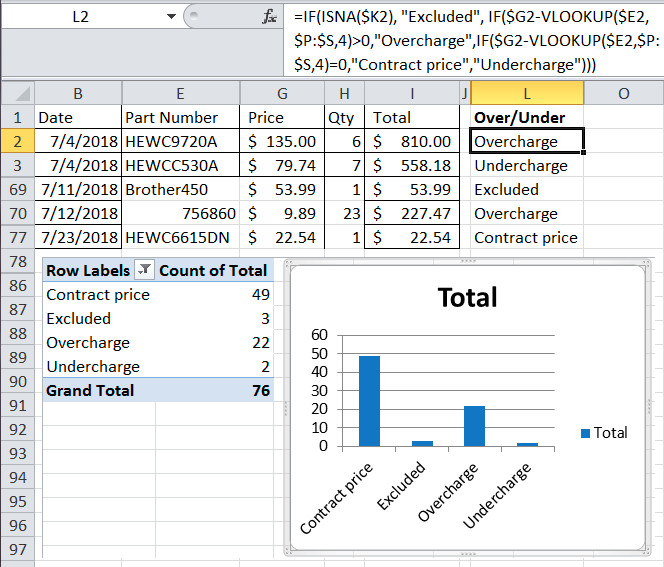
This was done by:
- Sorting the contract prices by Part Number so VLOOKUP will work
- Building a helper column K which is the difference between invoice price and VLOOKUP’d contract price (hidden)
- Building a VLOOKUP to compare contract price to invoice price (shown)
- Building a Pivot Table to roll up column L
Lots more could be done. For example, we could:
- Add a computation of the amount of overcharge.
- Add year-month to the pivot table, giving us an idea as to the distribution of the overcharges. Have they all occurred recently, or just in the relatively distant past?
- Produce a table of only the overcharged items, in order to send it to the vendor with a request for compensation.
- Identify “who” is buying the excluded items (more on this in Part III).
However, as the model becomes more complex, it becomes more difficult to maintain. What happens next month, when a new tranche of transactions is available? Who updates the model? Each of the formulas and pivot tables needs to be updated carefully — a process that’s irritating and time-consuming at best, as well as highly error-prone.
Make it Easy, not Hard
A spend analysis tool can make this a lot easier. Load the two datasets, and link them by Product Number. Then build a price difference column, set up a range, and you’re done. This requires no advanced Excel knowledge, and produces a model that updates automatically when new data are added. This dashboard was put together using Spendata, but there are certainly other options.
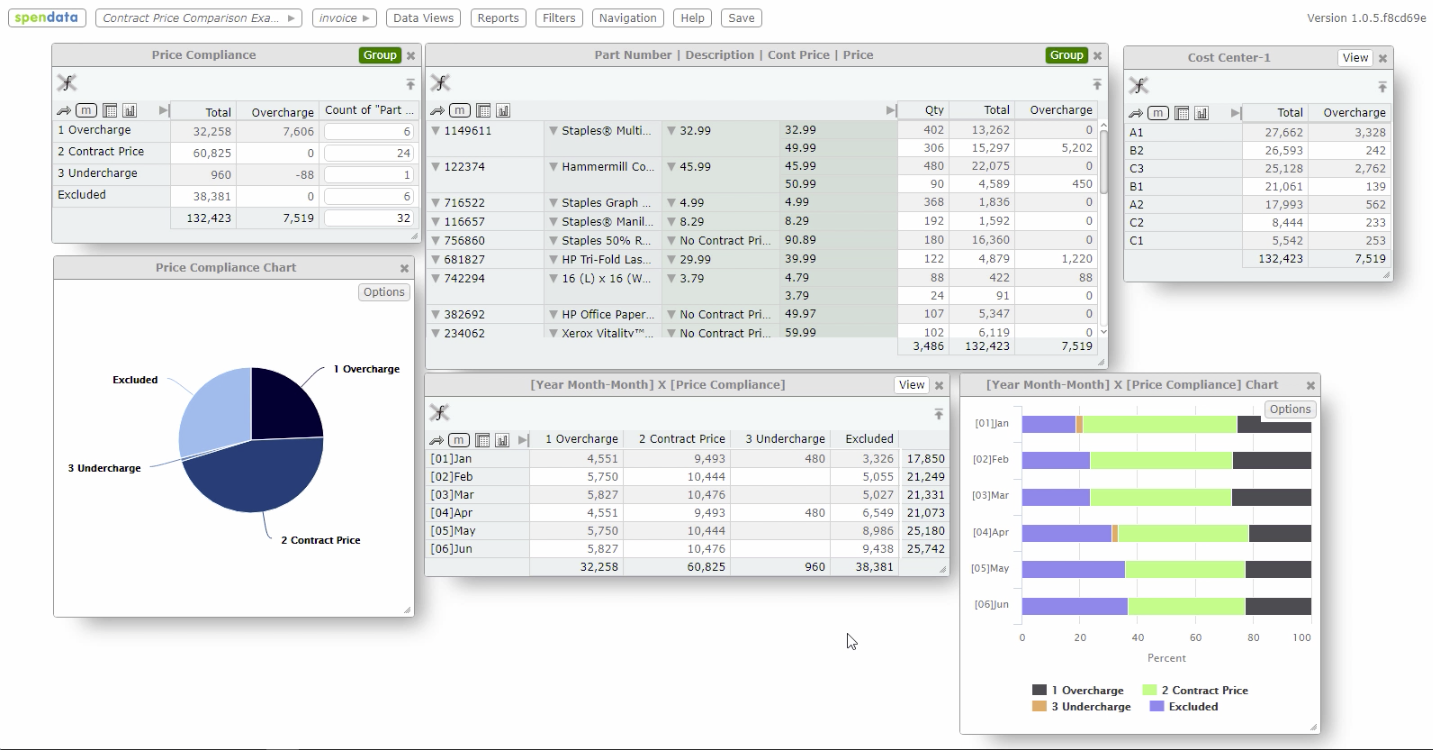
And now, adding next month’s data to the analysis is anticlimactic — literally a couple of clicks, and everything auto-updates. So, even if you could “do it in Excel”, you won’t, because it’s just too painful. But if you use the right tools, you can produce compliance models quickly, and you can maintain them with near-zero effort.
We’ll conclude our discussion in Part III: Monitoring Demand. Thanks, Eric!