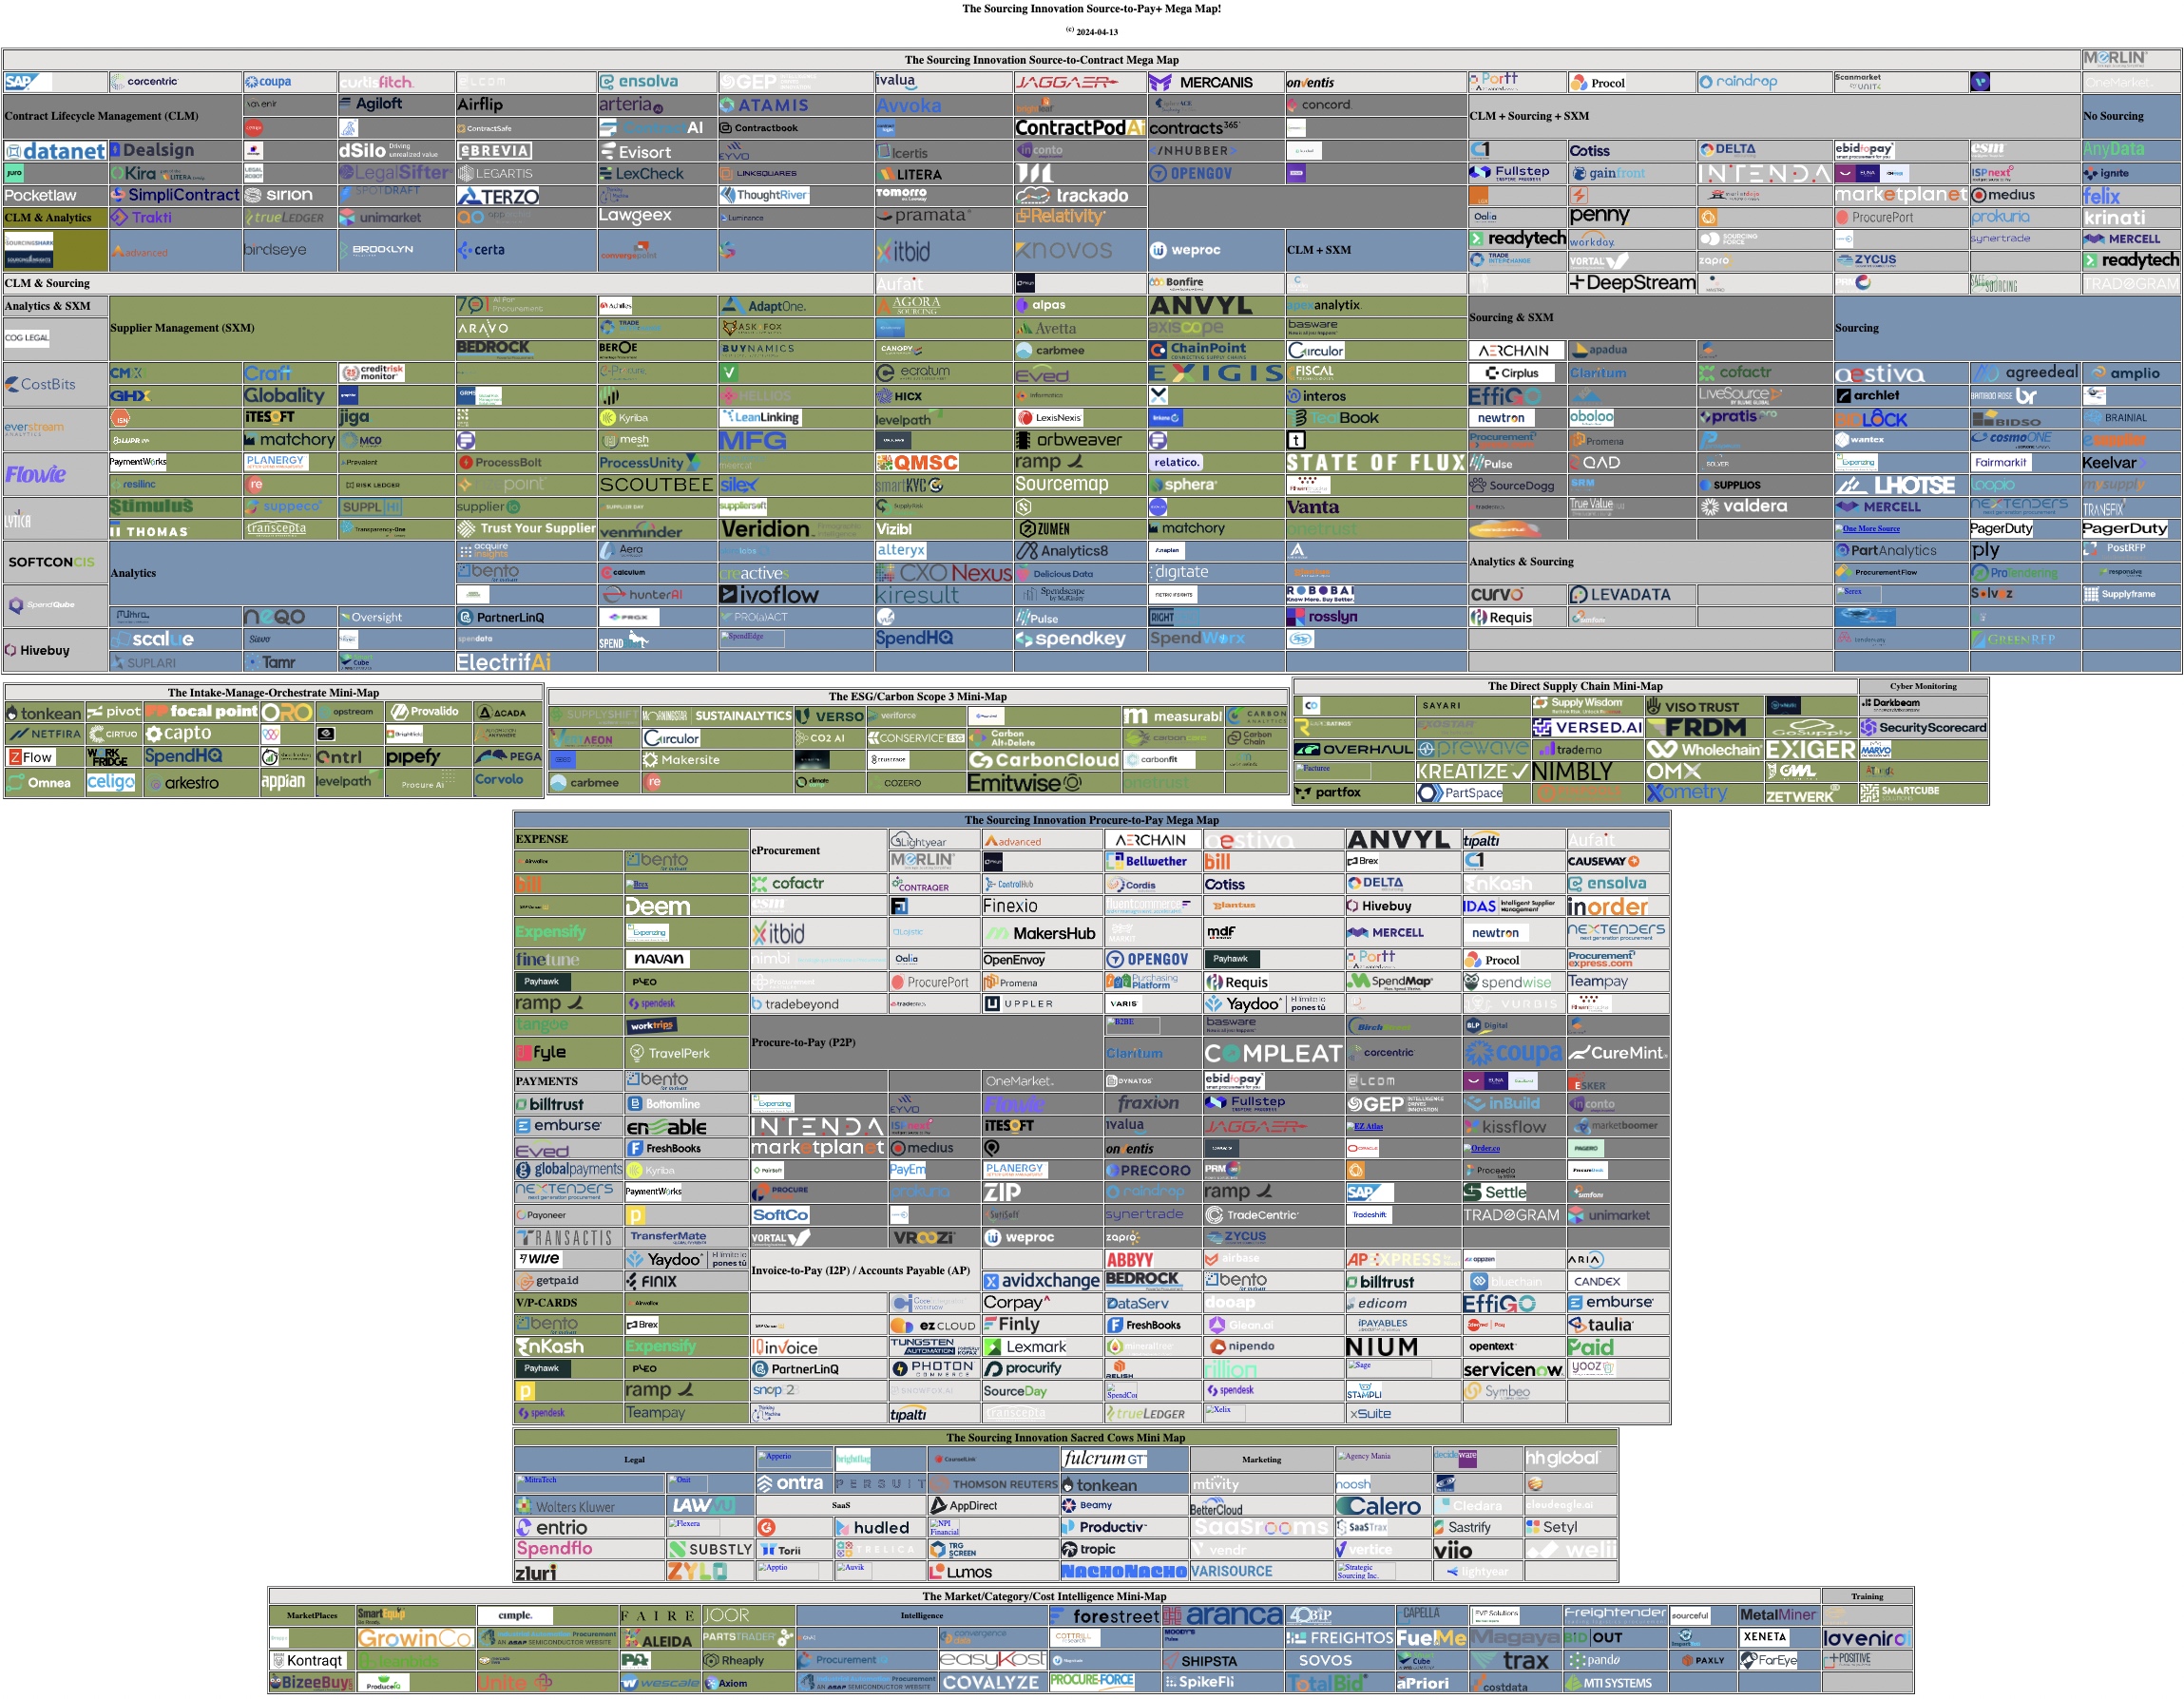
In our last article, we explained why the doctor created the The Sourcing Innovation Source-to-Pay+ Mega Map, even though he despises logo maps. It was literally the only way he could expose how every one of logo maps released to date was completely useless (and some to the point that they were harmful, but that’s another rant for a later time).
In a nutshell, all of these maps had the following problems, which were correctable (and corrected in the Sourcing Innovation Mega-Map):
- vendors / solutions no longer existed as of release date
- categories were meaningless and not actual solution modules
- vendor logos were not clickable or even footnoted (so you had no clue what that ruin actually represented — a new age vendor or a demonic symbol from a long lost hieroglyphic or symbolic language)
As well as the following problems, which still exist in the Sourcing Innovation Mega-Map (SIMM) because some of them are just not (fully) addressable:
- nowhere near complete (the further you get away from the Source-to-Pay core, the less complete the SIMM likely is
- no indication that the landscape changes DAILY (vendors come, get acquired/merge, go out of business, add new capabilities and modules, drop existing modules, etc.)
- the vendors aren’t always comparable even at a functionality baseline
- not all vendors with a comparable solution are relevant to the same (type of) company
We ended our last article noting that the right vendor for you was dependent not just on the module(s) you needed to address the process gaps the transformation consultants defined, but the industry/vertical you are in, the size of your organization, the cross-organization user base you need to support, and their technical intelligence (TQ).
The logo maps don’t capture that. (But, to be fair, the vast majority of the analyst market maps don’t either.)
But more importantly, they don’t always (accurately) capture what solution(s) a vendor accurately captures. The reason for this is that, to be completely accurate, the creator would have to be fully aware of, and have seen, the current full end-to-end solution as of the day the map was released and then accurately map the providers’ solutions to each of their logo map categories.
the doctor has likely reviewed more Source-to-Pay solutions over the past 19 years as an analyst than almost any other analyst except for Mickey North Rizza (15 years at AMR / Gartner / IDC), Duncan Jones (who was Forrester Vice President and Principal S2P analyst for 16 years straight), and Pierre Mitchell (25 years at AMR / Hackett / Spend Matters). (Just about every other technology analyst still active in our space has only been a full time market analyst for a decade or less.) Even though he has reviewed, in depth, over 500 hundred solutions (and written about 350+ in detail on Sourcing Innovation and Spend Matters [but good luck finding at least 1/3 of the Spend Matters coverage since, as previously mentioned, the site refresh dropped co-authors on many articles, many of his articles were co-authored, and he was always second billing], he hasn’t even seen half the solutions on the map in depth (but still believes the ratio of in-depth vendor knowledge that went into this map is still greater than every other logo map produced). As a result, his classifications, like any other analyst, are based on, in order:
- in depth demos, diligence or evaluation projects
- detailed vendor communications (beyond just what’s on the website)
- website / third party summaries (looking at the functionality where possible, not just the language)
Which means that, if the website/materials were out of date when reviewed (and it’s been a few years since the last review), the classification could now be highly inaccurate. The eProcurement vendor could have shifted mostly to I2P/AP. The supplier management vendor found a niche in risk management or category sourcing and dropped most SXM capabilities. The contract management solution, interchangeable with forty others, didn’t get traction and was dropped. And so on.
So if your mileage varies in this map, put together by someone who has consistently been at least a part time (if not full time) analyst since Sourcing Innovation was started in 2006, imagine how much it will vary in a map put together by a former consultant, who might have only seen the same ten solutions he was always implementing in depth, or a former product manager who doesn’t have a solid technical background and can’t accurately judge the true capabilities and potential of the solution he’s looking at. (the doctor has an earned PhD in computer science and has been a software architect / research scientist / CTO, compared to the average analyst who, in the early days, came from an operations / logistics / management background if you were lucky and a journalism,
English, or history background [because they could actually write] if you weren’t.)
In other words, no matter how cool these (logo) maps look, at best they will be mostly useless (if they give you clickable logos so you can begin your own research effort), or completely useless otherwise.
Secure Download the PDF! (or, use HTTP) [HTML]
(5.3M; Note that the Free Adobe Reader might choke on it; Preview on Mac or a Pro PDF application on Windows will work just fine)