Category Archives: Sourcing Innovation

the doctor dislikes logo maps! So why did he create one?

To demonstrate how, to date, they have all been completely useless, with some to the point of being actually harmful, but now that the gauntlet has been cast, he expects the next version of at least one of these maps to only be mostly useless (and maybe even only moderately useless) and mostly harmless. It’s the same reason he developed the initial versions of Solution Map*, because he found all of the big analyst firm maps mostly useless, and completely useless for tech selection.

(On the tech map front, how can you compare the technical capabilities of a solution where the axis are each on subjective classifications such as “strength and “strategy” or “execution” and “vision”, and, furthermore, where each of these nebulous concepts is made up of half a dozen subjective ratings meshed into one. While not perfect, at least Solution Map gave you an apples-to-apples pure objective technology rating (as each question had a defined rating scale based on technical maturity) against an unbiased pure customer opinion. So you at least knew whether or not

  1. the vendor actually offers a readily available solution of that type
  2. how it compares to the market average of vendors with actual available solutions of that type)

Thus, if you insisted on using logo maps, he at least wanted to make sure there was at least some redeeming qualities.  However, as he has already stated, his map is mostly useless and while a few flaws were corrected on release, some are inherently not addressable.  The problem with these maps in general is that, in addition to all the weaknesses the doctor addressed in his release post, namely:

  • Some vendors/solutions no longer existed as of release date (which was addressed)
  • Many of the categories are meaningless and not actual solution modules (which he corrected, but this means the fit varies across vendors in a category)
  • Vendor logos were not clickable, and not even footnoted when all you got was some strange symbol that looks like it should be carved on a 3000 year old ruin (which is the primary improvement, all logos are clickable and take you to the vendor site as of the release date).

4. They are nowhere near complete.
Most of these maps are in the 100 to 150 logo range. As the doctor has clearly demonstrated that’s only 1/7 to 1/10 of the number of vendors in the core space. Furthermore, even though the doctor does a full database update at least annually, he will guarantee that not even his map is close to complete. While he’d wager he has 90% of the vendors actively selling in North America and Western Europe in the core Source-to-Pay buckets, that percentage goes down as you venture out into the periphery. Plus, in some areas, like ESG/Carbon, he tracks only those focussed on carbon/scope 3 accounting with supplier management / sourcing integration capability, and ignores the remaining ESG/Sustainability/Climate vendors, of which there is likely 10 times as many right now (although we’ll see a lot get swallowed up or die off as the space matures). Most of the supply chain risk vendors are missing unless they offer core supplier management capabilities, or integrate with supplier management modules, as well. And so on.

5. The landscape changes daily.
the doctor did a full database review last year when he did his 39 steps … err … 39 clues … err … 39 part Source-to-Pay+ series, and since then, over half a dozen vendors/offerings are completely gone and over a dozen acquired and swallowed into larger vendors. One, acquired in 2022 that was still offered as a standalone solution late March disappeared by the final link checks that began on April 13. So, while these maps are distributed by their creators for months, and sometimes a year, they are only valid as of the last date where the creator actually re-verified every single vendor.

6. The vendors are only comparable at the baseline, IF they are comparable at all.
If no two (2) vendors are created equal, imagine how different twenty (20) are, or one hundred (100)! If you refer back to our previously referenced 39 part Source-to-Pay+ series,

  • sourcing vendors break down into RFX, Auction, optimization and may/not contain (best-practice) templates or category expertise
  • contract management generally breaks down into negotiation support, (post-signing) lifecycle (execution) management and tracking, and analytics
  • spend analysis is similar, but differs on DIY vs. services led, load/classification support vs. self load/(re)class, out of the box report templates, autonomous analysis and opportunity identification, etc.
  • supplier management was broken down into the 10-segment CORNED QUIP mash, which expressly excluded DEI, because most application thereof is definitely NOT equitable (as the biggest promoters clearly never looked up what the words actually mean in a dictionary)
  • eProcurement, while it revolves around a PO (and, hopefully, a no PO, no pay policy), may or may not have punchout/internal/managed catalog support, may or may not support receiving, may or may not support price tiers and discounts, etc.
  • I2P, while it revolves around the invoice, it may or may not support anything beyond internal PO flip or XML, may or may not support m-way match, may or may not integrate with a payment system, etc.
  • and the same variation exists across every other category

This is assuming that the creator actually understood what every vendor offered and classified according to what the vendor’s product actually did vs. what language the vendor chose to use to describe their product.

7. Even all the vendors with comparable solutions are NOT relevant for you.

When you are considering a vendor, at the very least you have to consider

  • the verticals/industries their solution was designed on, and designed for
  • the organizational size they were developed for

and a host of other considerations based on your industry, your organizational size, and the hole you are trying to fill.

This is why so many Source-to-Pay+ selection projects end up not (fully) delivering and why most big consultancies just keep recommending the same-old same-old five (5) (big) vendors regardless of what your needs are, because they don’t know any different and at least those vendors will be around tomorrow. And this leads into a bigger discussion of why these logo maps, like most analyst maps, are NOT appropriate for transformation projects. Which we’ll take up in our next article / rant.

Secure Download the PDF!  (or, use HTTP) [HTML]
(5.3M; Note that the Free Adobe Reader might choke on it; Preview on Mac or a Pro PDF application on Windows will work just fine)

* and the doctor would like to make it very clear he had NOTHING to do with the current interface and presentation of Solution Map; it’s likely many of the questions are still his, but to be valuable, SolutionMap has to be properly scored and the ratings properly compared and applied relative to a number of factors not explicitly captured in the map

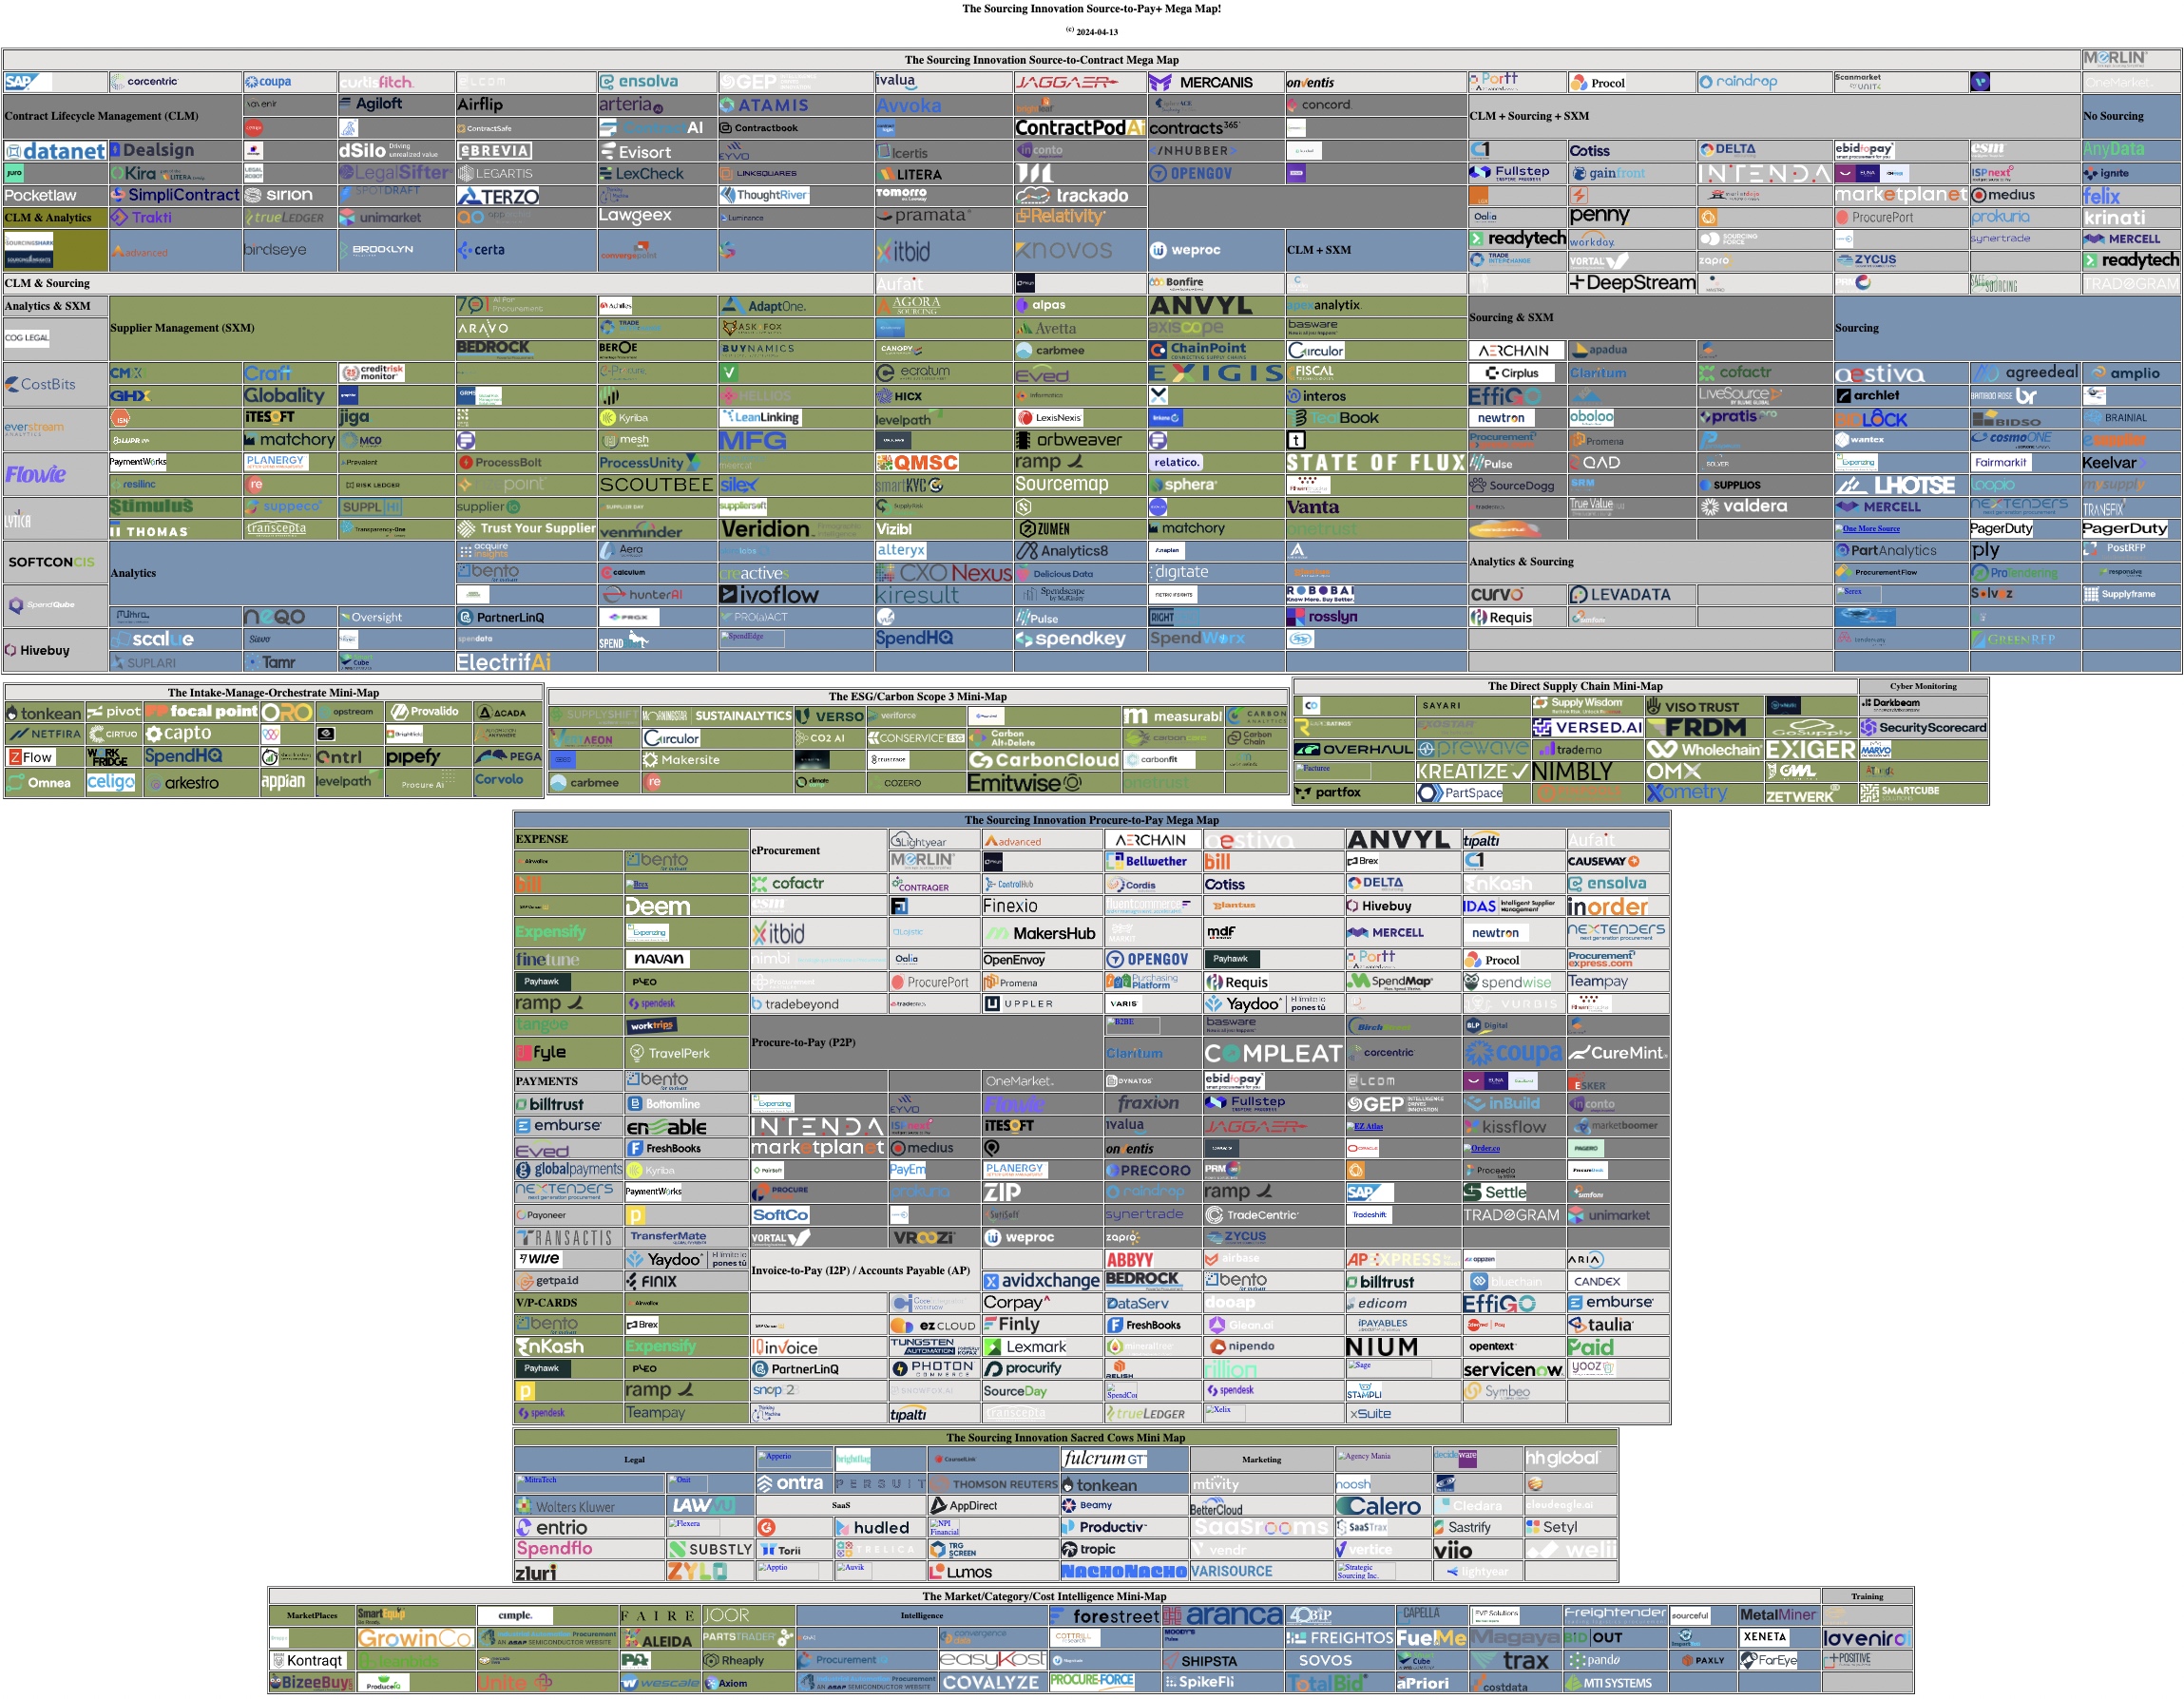
The Sourcing Innovation Source-to-Pay+ Mega Map!

Now slightly less useless than every other logo map that clogs your feeds!

1. Every vendor verified to still be operating as of 4 days ago!
Compare that to the maps that often have vendors / solutions that haven’t been in business / operating as a standalone entity in months on the day of release! (Or “best-of” lists that sometimes have vendors that haven’t existed in 4 years! the doctor has seen both — this year!)

2. Every vendor logo is clickable!
the doctor doesn’t know about you, but he finds it incredibly useless when all you get is a strange symbol with no explanation or a font so small that you would need an electron microscope to read it. So, to fix that, every logo is clickable so you can go to the site and at least figure out who the vendor is.

3. Every vendor is mapped to the closest standard category/categories!
Furthermore, every category has the standard definitions used by Sourcing Innovation and Spend Matters!
the doctor can’t make sense of random categories like “specialists” or “collaborative” or “innovative“, despises when maps follow this new age analyst/consultancy award trend and give you labels you just can’t use, and gets red in the face when two very distinct categories (like e-Sourcing and Marketplaces or Expenses and AP are merged into one). Now, the doctor will also readily admit that this means that not all vendors in a category are necessarily comparable on an apples-to-apples basis, but that was never the case anyway as most solutions in a category break down into subcategories and, for example, in Supplier Management (SXM) alone, you have a CORNED QUIP mash of solutions that could be focused on just a small subset of the (at least) ten different (primary) capabilities. (See the link on the sidebar that takes you to a post that indexes 90+ Supplier Management vendors across 10 key capabilities.)

Secure Download the PDF!  (or, use HTTP) [HTML]
(5.3M; Note that the Free Adobe Reader might choke on it; Preview on Mac or a Pro PDF application on Windows will work just fine)

Spendata: The Power Tool for the Power Spend Analyst — Now Usable By Apprentices as Well!

We haven’t covered Spendata much on Sourcing Innovation (SI), as it was only founded in 2015 and the doctor did a deep dive review on Spend Matters in 2018 when it launched (Part I and Part II, ContentHub subscription required), as well as a brief update here on SI where we said Don’t Throw Away that Old Spend Cube, Spendata Will Recover It For You!. the doctor did pen a 2020 follow up on Spend Matters on how Spendata was Rewriting Spend Analysis from the Ground Up, and that was the last major coverage. And even though the media has been a bit quiet, Spendata has been diligently working as hard on platform improvement over the last four years as they were the first four years and just released Version 2.2 (with a few new enhancements in the queue that they will roll out later this year). (Unlike some players which like to tack on a whole new version number after each minor update, or mini-module inclusion, Spendata only does a major version update when they do considerable revamping and expansion, recognizing that the reality is that most vendors only rewrite their solution from the ground up to be better, faster, and more powerful once a decade, and every other release is just an iteration, and incremental improvement of, the last one.)

So what’s new in Spendata V 2.2? A fair amount, but before we get to that, let’s quickly catch you up (and refer you to the linked articles above for a deep dive).

Spendata was built upon a post-modern view of spend analysis where a practitioner should be able to take immediate action on any data she can get her hands on whenever she can get her hands on it and derive whatever insights she can get for process (or spend) improvement. You never have perfect data, and waiting until Duey, Clutterbuck, and Howell1 get all your records in order to even run your first report when you have a dozen different systems to integrate data from, multiple data formats to map, millions of records to classify, cleanse and enrich, and third party data feeds to integrate will take many months, if not a year, and during that year where you quest for the mythical perfect cube you will continue to lose 5% due to process waste, abuse, and fraud, and 3% to 15% (or more) across spend categories where you don’t have good management but could stem the flow simply by identifying them and putting in place a few simple rules or processes. And you can identify some of these opportunities simply by analyzing one system, one category, and one set of suppliers. And then moving on to the next one. And, in the process, Spendata automatically creates and maintains the underlying schema as you slowly build up the dimensions, the mapping, cleansing, and categorization rules, and the basic reports and metrics you need to monitor spend and processes. And maybe you can only do 60% to 80% piecemeal, but during that “piecemeal year”, you can identify over half of your process and cost savings opportunities and start saving now, versus waiting a year to even start the effort. When it comes to spend (related) data analysis, no adage is more true than “don’t put off until tomorrow what you can do today” with Spendata, because, and especially when you start, you don’t need complete or perfect data … you’d be amazed how much insight you can get with 90% in a system or category, and then if the data is inconclusive, keeping drilling and mapping until you get into the 95% to 98% accuracy range.

Spendata was also designed from the ground up to run locally and entirely in the browser, because no one wants to wait for an overburdened server across a slow internet connection, and do so in real time … and by that we mean do real analysis in real time. Spendata can process millions of records a minute in the browser, which allows for real time data loads, cube definitions, category re-mappings, dynamically derived dimensions, roll-ups, and drill downs in real-time on any well-defined data set of interest. (Since most analysis should be department level, category level, regional, etc., and over a relevant time span, that should not include every transaction for the last 10 years because beyond a few years, it’s only the quarter over quarter or year over year totals that become relevant, most relevant data sets for meaningful analysis even for large companies are under a few million transactions.) The goal was to overcome the limitations of the first two generations of spend analysis solutions where the user was limited to drilling around in, and deriving summaries of, fixed (R)OLAP cubes and instead allow a user to define the segmentations they wanted, the way they wanted, on existing or newly loaded (or enriched federated data) in real time. Analysis is NOT a fixed report, it is the ability to look at data in various ways until you uncover an inefficiency or an opportunity. (Nor is it simply throwing a suite of AI tools against a data set — these tools can discover patterns and outliers, but still require a human to judge whether a process improvement can be made or a better contract secured.)

Spendata was built as a third generation spend analysis solution where

  • data can be loaded and processed at any point of the analysis
  • the schema is developed and modified on the fly
  • derived dimensions can be created instantly based on any combination of raw and previously defined derived dimensions
  • additional datasets from internal or external sources can be loaded as their own cubes, which can then be federated and (jointly) drilled for additional insight
  • new dimensions can be built and mapped across these federations that allow for meaningful linkages (such as commodities to cost drivers, savings results to contracts and purchasing projects, opportunities by size, complexity, or ABS analysis, etc.)
  • all existing objects — dimensions, dashboards, views (think dynamic reports that update with the data), and even workspaces can be cloned for easy experimentation
  • filters, which can define views, are their own objects, can be managed as their own objects, and can be, through Spendata‘s novel filter coin implementation, dragged between objects (and even used for easy multi-dimensional mapping)
  • all derivations are defined by rules and formula, and are automatically rederived when any of the underlying data changes
  • cubes can be defined as instances of other cubes, and automatically update when the source cube updates
  • infinite scrolling crosstabs with easy Excel workbook generation on any view and data subset for those who insist on looking at the data old school (as well as “walk downs” from a high-level “view” to a low-level drill-down that demonstrates precisely how an insight was found
  • functional widgets which are not just static or semi-dynamic reporting views, but programmable containers that can dynamically inject data into pre-defined analysis and dimension derivations that a user can use to generate what-if scenarios and custom views with a few quick clicks of the mouse
  • offline spend analysis is also available, in the browser (cached) or on Electron.js (where the later is preferred for Enterprise data analysis clients)

Furthermore, with reference to all of the above, analyst changes to the workspace, including new datasets, new dashboards and views, new dimensions, and so on are preserved across refresh, which is Spendata’s “inheritance” capability that allows individual analysts to create their own analyses and have them automatically updated with new data, without losing their work …

… and this was all in the initial release. (Which, FYI, no other vendor has yet caught up to. NONE of them have full inheritance or Spendata‘s security model. And this was the foundation for all of the advanced features Spendata has been building since its release six years ago.)

After that, as per our updates in 2018 and 2020, Spendata extended their platform with:

  • Unparalleled Security — as the Spendata server is designed to download ONLY the application to the browser, or Spendata‘s demo cubes and knowledge bases, it has no access to your enterprise data;
  • Cube subclassing & auto-rationalization — power users can securely setup derived cubes and sub-cubes off of the organizational master data cubes for the different types of organizational analysis that are required, and each of these sub-cubes can make changes to the default schema/taxonomy, mappings, and (derived) dimensions, and all auto-update when the master cube, or any parent cube in the hierarchy, is updated
  • AI-Based Mapping Rule Identification from Cube Reverse Engineering — Spendata can analyze your current cube (or even a report of vendor by commodity from your old consultant) and derive the rules that were used for mapping, which you can accept, edit, or reject — we all know black box mapping doesn’t work (no matter how much retraining you do, as every “fix” all of a sudden causes an older transaction to be misclassified); but generating the right rules that can be human understood and human maintained guarantees 100% correct classification 100% of the time
  • API access to all functions, including creating and building workspaces, adding datasets, building dimensions, filtering, and data export. All Spendata functions are scriptable and automatable (as opposed to BI tools with limited or nonexistent API support for key functions around building, distributing, and maintaining cubes).

However, as we noted in our introduction, even though this put Spendata leagues beyond the competition (as we still haven’t seen another solution with this level of security; cube subclassing with full inheritance; dynamic workspace, cube, and view creation; etc.), they didn’t stop there. In the rest of this article, we’ll discuss what’s new from the viewpoint of Spendata Competitors:

Spendata Competitors: 7 Things I Hate About You

Cue the Miley Cyrus, because if competitors weren’t scared of Spendata before, if they understand ANY of this, they’ll be scared now (as Spendata is a literal wrecking ball in analytic power). Spendata is now incredibly close to negating entire product lines of not just its competitors, but some of the biggest software enterprises on the planet, and 3.0 may trigger a seismic shift on how people define entire classes of applications. But that’s a post for a later day (but should cue you up for the post that will follow this on on just precisely what Spendata 2.2 really is and can do for you). For now, we’re just going to discuss seven (7) of the most significant enhancements since our last coverage of Spendata.

Dynamic Mapping

Filters can now be used for mapping — and as these filters update, the mapping updates dynamically. Real-time reclassify on the fly in a derived cube using any filter coin, including one dragged out of a drill down in a view. Analysis is now a truly continuous process as you never have to go back and change a rule, reload data, and rebuild a cube to make a correction or see what happens under a reclassification.

View-Based Measures

Integrate any rolled up result back into the base cube on the base transactions as a derived dimension. While this could be done using scripts in earlier versions, it required sophisticated coding skills. Now, it’s almost as easy as a drag-and-drop of a filter coin.

Hierarchical Dashboard Menus

Not only can you organize your dashboards in menus and submenus and sub-sub menus as needed, but you can easily bookmark drill downs and add them under a hierarchical menu — makes it super easy to create point-based walkthroughs that tell a story — and then output them all into a workbook using Spendata‘s capability to output any view, dashboard, or entire workspace as desired.

Search via Excel

While Spendata eliminates the need for Excel for Data Analysis, the reality is that is where most organizational data is (unfortunately) stored, how most data is submitted by vendors to Procurement, and where most Procurement Professionals are the most comfortable. Thus, in the latest version of Spendata, you can drag and drop groups of cells from Excel into Spendata and if you drag and drop them into the search field, it auto-creates a RegEx “OR” that maintains the inputs exactly and finds all matches in the cube you are searching against.

Perfect Star Schema Output

Even though Spendata can do everything any BI tool on the market can do, the reality is that many executives are used to their pretty PowerBI graphs and charts and want to see their (mostly static) reports in PowerBI. So, in order to appease the consultancies that had to support these executives that are (at least) a generation behind on analytics, they encoded the ability to output an entire workspace to a perfect star schema (where all keys are unique and numeric) that is so good that many users see a PowerBI speed up by a factor of almost 10. (As any analyst forced to use PowerBI will tell you, when you give PowerBI any data that is NOT in a perfect star schema, it may not even be able to load the data, and that it’s ability to work with non-numeric keys at a speed faster than you remember on an 8088 is nonexistent.)

Power Tags

You might be thinking “tags, so what“. And if you are equating tags with a hashtag or a dynamically defined user attribute, then we understand. However, Spendata has completely redefined what a tag is and what you can do with it. The best way to understand it is a Microsoft Excel Cell on Steroids. It can be a label. It can be a replica of a value in any view (that dynamically updates if the field in the view updates). It can be a button that links to another dashboard (or a bookmark to any drill-down filtered view in that dashboard). Or all of this. Or, in the next Spendata release, a value that forms the foundation for new derivations and measures in the workspace just like you can reference a random cell in an Excel function. In fact, using tags, you can already build very sophisticated what-if analysis on-the-fly that many providers have to custom build in their core solutions (and take weeks, if not months, to do so) using the seventh new capability of Spendata, and usually do it in hours (at most).

Embedded Applications

In the latest version of Spendata, you can embed custom applications into your workspace. These applications can contain custom scripts, functions, views, dashboards, and even entire datasets that can be used to instantly augment the workspace with new analytic capability, and if the appropriate core columns exist, even automatically federate data across the application datasets and the native workspace.

Need a custom set of preconfigured views and segments for that ABC Analysis? No sweat, just import the ABC Analysis application. Need to do a price variance analysis across products and geographies, along with category summaries? No problem. Just import the Price Variance and Category Analysis application. Need to identify opportunities for renegotiation post M&A, cost reduction through supply base consolidation, and new potential tail spend suppliers? No problem, just import the M&A Analysis app into the workspace for the company under consideration and let it do a company A vs B comparison by supplier, category, and product; generate the views where consolidation would more than double supplier spend, save more than 100K on switching a product from a current supplier to a lower cost supplier; and opportunities for bringing on new tail spend suppliers based upon potential cost reductions. All with one click. Not sure just what the applications can do? Start with the demo workspaces and apps, define your needs, and if the apps don’t exist in the Spendata library, a partner can quickly configure a custom app for you.

And this is just the beginning of what you can do with Spendata. Because Spedata is NOT a Spend Analysis tool. That’s just something it happens to do better than any other analysis tool on the market (in the hands of an analyst willing to truly understand what it does and how to use it — although with apps, drag-and-drop, and easy formula definition through wizardly pop-ups, it’s really not hard to learn how to do more with Spendata than any other analysis tool).

But more on this in our next article. For The Times They Are a-Changin’.

1 Duey, Clutterbuck, and Howell keeps Dewey, Cheatem, and Howe on retainer … it’s the only way they can make sure you pay the inflated invoices if you ever wake up and realize how much you’ve been fleeced for …

Strategic Sourcing & Procurement for Technology Cost Optimization

Given that we recently published a piece noting that Roughly Half a Trillion Dollars Will Be Wasted on SaaS Spend This Year and up to One Trillion Dollars on IT Services, it’s obvious that one has to be very careful with technology acquisition as it is very easy to overspend on the license and the implementation for something that doesn’t even solve your problem.

As a result, you need to be very strategic about it. While you certainly can’t put the majority of your technology acquisitions (which can be 6, 7, and even 8 figures) up for auction (as products are never truly apples to apples to apples), you definitely have to be strategic about it. As a result, you should be doing multi-round RFPs and then awarding to the vendor who brings you the best overall value for the term you want to commit to, once all things are considered.

But these have to be well thought out … you need to make sure that you are only inviting providers that are likely to meet 100% of your must haves, 80% of your should haves, and 60% of your nice to haves (and, moreover, that you have really separated out absolute vs highly desired vs wanted but not needed because the more you insist on, especially when it’s not necessary, the shallower the vendor pool, and the more you are going to end up paying*).

To do this, as the article notes, you have to know what processes you need to support, what improvements you are expecting, what measurements you need the platform to take, and what business objectives it needs to support. Then you need to align your go-to-market sourcing/procurement strategy with those objectives and make sure the RFP covers all the core requirements (without asking 100 unnecessary questions about features you’ll never actually use in practice).

You also need to know what quantifiable benefits the platform should deliver, both in terms in tactical work(force) reduction (as the tech you acquire should be good at thunking), and the value that will be obtained from the strategic enablement (in terms of analysis, intelligence gathering, guided events, etc.) the platform should deliver. If it is a P2P platform, how much invoice processing is it going to automate, and, based on that, how much is it going to reduce your average invoice processing cost? If it’s a sourcing platform, how much more spend will you be able to source (without increasing person-power) and what is a reasonable savings percentage to expect on that? Understand the value before you go to market.

Then you need to understand how much support and help you need from the vendor. If you just want a platform that does a function, then you just need to know the vendor can support the platform in supporting that function. But if you need help in process transformation or optimization, customized development or third party tool integration for advanced/custom processes, etc. you need a vendor that cannot only provide services, but also be a strategic provider for you as well.

And so on. For more insights, we suggest you check out a recent article by Alix Partners on Strategic Sourcing and Procurement for Technology Cost Optimisation. It has a lot of great advice for those starting their strategic procurement technology journey.

*Just remember, if you’re a mid-market, and you’re flexible (i.e. define what a module needs to accomplish for you vs. a highly specific process) you can get your absolute functionality and most of your desired functionality for 120K in annual SaaS license fees, excluding data feeds and services. If you’re not flexible, or not really strict in really separating out absolute vs strongly desired vs nice-to-have, you can easily be paying four times that.

Also remember, if you’re enterprise, your absolutes and strongly desired are much more extensive, typically require a lot more advanced tech (like optimization, predictive analytics, ML/AI, etc.), and licenses fees alone will cost you in the 500K to 1M range annually at a minimum, not counting the 100K to 1M you will need to spend on the implementation, data cleansing and enrichment, integration, training, and real-time data feed access, so it is absolutely vital you get it right!

Sourcing Success in these Turbulent Times Require Long Term Planning and Cost Concessions

In a McKinsey article a few months back on How medium-size enterprises can better manage sources, McKinsey said that small and medium-size enterprises often struggle to find Procurement cost savings. Yet there are ways to do it while still pursing growth and providing a superior customer experience. The article, which concluded with an action plan for procurement cost savings, recommended:

  • establishing CoE teams
  • improving forecasting
  • expanding (the) use of digital procurement tools
  • gaining greater market intelligence
  • establishing a culture of — and process for — continuous cost improvement
  • incorporating supplier-driven product improvements

which, of course, are all great suggestions, and mostly address four of the five reasons that McKinsey give that prevent companies from reining in spending, which included

  • a lack of spending transparency (which would have to be corrected to improve forecasting)
  • talent gaps (which can be minimized with the right tools, market intelligence, and CoE teams)
  • underused digital tools and automation (which is directly addressed by using more of them)
  • exclusion of procurement and supply chain in business decision (which would hopefully be a byproduct of a corporate culture for continuous cost improvement that only happens when procurement and supply chain is not involved higher up)

but the fifth is largely unaddressed — the myopic focus on the short term which McKinsey claims could be addressed by putting more effort into planning and forecasting. But that doesn’t solve the problem.

Better forecasting will allow for longer contracts to be signed for higher volumes, which can lead to long term strategic supplier relationships, and better planning can allow this to happen, but this does not completely address the need for long term planning.

Supply Chains today are not the supply chains of the last ten to twenty years.

  • rare earths are even rarer
  • many critical raw materials are in increasingly limited or short supply
  • transportation can be unpredictable in availability and cost; even though most of the world declared COVID over in mid-2022, China still had mandatory lockdowns, ocean carriers scrapped many of their ships for insurance (and in some cases, post-panamax ships that had never made a single voyage), airlines furloughed too many pilots who found other jobs or just flat out retired, and the long-haul trucking in North America (the UK, and many first-world countries) has been on a steady decline for over a deacde
  • ESG/GHG/Carbon Requirements are escalating around the globe and you need to be in compliance (both in terms of reporting 1/2/3 and ensuring you don’t exceed any caps)
  • human/labour rights are escalating and you have to be able to trace compliance down to the source in some jurisdictions; you need suppliers who insist on the same visibility that you do
  • diversity is important not just to meet arbitrary requirements for government programs or arbitrary internal goals, but to ensure you have the right insight and expertise to solve all types of problems that might arise

And you can’t effectively address any of these problems unless you think long term AND accept that some of the solutions will cost more up front.

  • In mid November, the trading price for Neodymium (a rare-earth that is critical for the creation of strong permanent magnets, which makes it possible to miniaturize many electronic devices, including the [smart]phone you might be reading this on) was over $87,000 USD/mt. In comparison, hot roll steel was around $850 USD/mt. In other words, Neodymium was 100 times more expensive than steel. And while you can still buy steel for about the same price you could 10 years ago (it was around $900 USD/mt), Neodynmium is almost $20,000 more (as it was around $69,000 USD/mt in November 2013). It’s not the only rare earth to increase about 26% in 10 years, with further increases on the horizon. You need to have a strategy to minimize your need (which could include product redesigns that use more sustainable alternatives or recycling strategies that use recovered materials from older phone models). And when it comes to recycled materials, due to a historical lack of recycling efforts, or research into technologies to make recycling efficient and cost effective, recycled materials are almost always more expensive at first. Always. But as adoption increases, plants, technologies, and processes get more efficient, and the cost goes down (while, at the same time, raw material prices for materials in limited supply continue to go up). In other words, if you want to mitigate the ever-increasing costs for rare earths and other materials that are in limited supply, you have to incorporate the use of recycled materials, and maybe even invest in your own plants (and recycle your own phones you buy back because it’s cheaper just to buy them back and extract the rare earths yourself than buy the recycled rare earths from someone else).
  • Global trade is costly and unpredictable. Supply assurance is finally dictating near-sourcing and home-sourcing (which SI has been advocating for almost fifteen years, as inevitable disaster was the logical conclusion of outsourcing everything to China as eventually a pandemic, global spat, natural disaster, or other event would send shockwaves through the world when it severely disrupted the trade routes [because even though the chances of a pandemic, natural disaster on the scale of Krakatoa or the Valdivia earthquake, or another catastrophic event is minimal in any given year, over the course of a century, it becomes very likely]), and that is going to require re-investing in those Mexican factories (that worked just fine, by the way) you shut down twenty years ago, training appropriately skilled workers in low cost North American (or Eastern Europe) locales, and paying a bit more per unit (and even transportation until the carriers rebuild those routes). But in the long term, as global transportation costs continue to rise, and the local-ish resources get much more efficient (using the best technology we have to offer), your costs, and transportation risks, will go down while your competitor costs continue to go up.
  • if you don’t insist, and ensure, up front that your suppliers can report the data you need, how will you get it; chances are those suppliers need help and modern systems, which temporarily increase their operational costs as they install, integrate, and learn the systems; not more than a few cents here and there per unit, but a noticeable blip on the overall costs none-the-less
  • if you want suppliers that monitor their supply chain and insist on no slave/forced/child labour, appropriately treated and well paid labour, and, better yet, a community focus throughout the supply chain (so that the humans who mine the materials, harvest the food stuffs, weave the silk, or otherwise do the foundational work have a reasonable quality of life, health, and safety), you’re going to have to put the effort in to find them and the extra money to support them in their humanitarian efforts; since most of these workers in remote low-cost locales are paid pennies on your dollar, it’s another blip on the total cost to ensure they are paid every penny they deserve, but it’s still a blip; but you can’t afford not to do it if your jurisdiction has laws making you responsible for slave labour that later gets discovered in your supply chain
  • and while diversity shouldn’t cost more, since it’s the same number of employees, the reality is that the supply base embracing it could be a minority, and if these minority suppliers suddenly become in demand, market dynamics may kick in and they may charge a premium that your competitor will pay; but, as new challenges continue to arise, you will need the diversity to solve them; so, another blip in the cost you need to absorb

In other words, you need the long term focus to guarantee success, and you need to understand that, up front, it may cost a bit more. However, done right, your costs will decrease over time while your competitors’ costs skyrocket. So if you truly want success, in any high dollar, strategic, or emerging category, plan for the long term. And you will truly succeed.